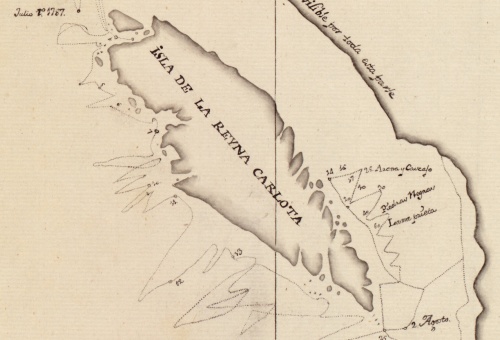
Dixon’s 1787 map showing Haida Gwaii as an Island. Source: Library of Congress
Old Maps are Cool. Enough said. Or maybe not quite enough. Continue reading

Dixon’s 1787 map showing Haida Gwaii as an Island. Source: Library of Congress
Old Maps are Cool. Enough said. Or maybe not quite enough. Continue reading
Posted in archives, First Nations, Haida Gwaii, history, Northwest Coast
Tagged Captain Dixon, cartography, charts, Haida Gwaii, Haida Nation, maps

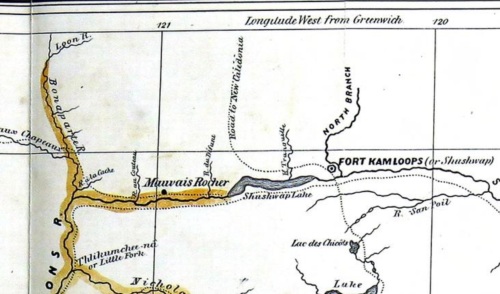
Anderson’s map of the Kamloops area 1858. Note R. aux Chapeaux (Hat Creek) and R. de la Cache (Cache Creek) to west; Shushwap Lake (Kamloops Lake) and the North Branch (of the Thompson River). Kumcheen / Little Fork, just upstream of Spence’s Bridge at the Nicola – Thompson confluence, lower left.
There were a lot of ways to make money from the B.C. Gold rushes which started in the mid 1850s. One of these was to publish a guide book to help prospecters enter the Gold Fields from starting points at The Dalles on the lower Columbia River or at Fort Langley, east of present-day Vancouver. Few were better prepared to write such a guide book (price: $1.50) than Alexander Caulfield Anderson, who had at least a decade of experience surveying for accessible routes into the interior of BC, especially Brigade Trails along which horse trains could pass.
The Gold Rush was, of course, one the of the main spearheads of colonialism and instigated or continued a lot of painful dispossession of Interior First Nations. Anderson’s guide, available online (lower resolution 20 meg PDF direct download) can be read in many ways, but it is a valuable document of a slice of time (it is dated May 3rd, 1858, a watershed year in the history of B.C.), just as the middle Fraser Gold Rush was gaining steam but before the Cariboo Rush of the 1860s. It’s a pragmatic guide that gives landmarks, travel times, names of First Nations’ villages, where to catch sturgeon, how to hire a canoe, and other practical information and, of course, it includes an interesting map on the last pages, showing overland routes into and around the Interior.
Posted in anthropology, archives, First Nations, history, Northwest Interior, Uncategorized
Tagged Alexander Anderson, BC History, Gold Rush, maps
Space is important to archaeologists, but it can be really easy to have a distorted sense of how big the world is, and how big different parts are compared to each other. One big reason for this globally is that common map projections tend to make more northerly and southerly places appear much larger. But on a local scale, even knowing that a place is so many square kilometres compared to some other place is not always that illuminating. It’s hard for a small human to get their head around big spaces, or abstract ones.
This all matters because what archaeologists study is the human scale of feet-on-ground, and it is easy to lose that when confronted with a top-down view, bird-in-air, which apart from anything else, is pretty much a point of view no human has ever occupied, at least until very recently. It is pretty handy then to find an easy to use online tool called MapFrappe, which allows you to outline a geographic feature, then drag it to anywhere in the world – while preserving its map projection scale.
For example, Vancouver Island is a familiar feature to many NW Coast archaeologists.
If you’re at all a map geek – and most archaeologists have that tendency – then you might enjoy flipping around Stanford’s Spatial History Mapping Project. This project is intended to further creative visual analysis and representation of historical events and phenomena. Luckily for us, they apply their skills to some archaeological problems, such as the relationship between sea level change and shell mound development illustrated above:
Did rising sea levels force native people to raise their shellmounds to stay above the tides? The visualization suggests that no, mound building was unrelated to sea level rise.
You can see that particular page here.

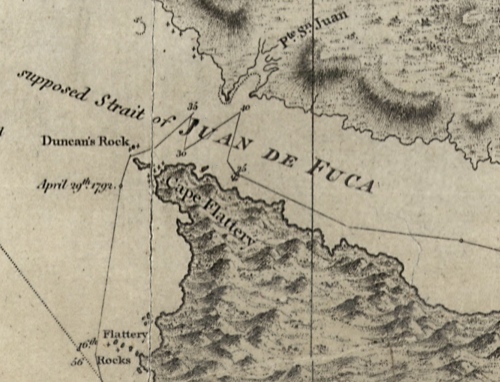
Detail of Capt. Vancouver's 1792 chart showing the "supposed strait of Juan de Fuca". Source: viHistory
vihistory is a web site designed to aid in historical research of Vancouver Island, at which it succeeds admirably. You should poke around and have fun with their census data and the other worthy, if dreary, pursuits it affords the serious scholar.
One feature which is not immediately clear on first glance, perhaps deliberately as has entertainment potential, is a large selection of very high-resolution maps and images which you can download from this page. The file sizes are large, of course, but increasingly that is less of an obstacle in the past. The maps are mostly of historic Victoria, but there are some regional maps such as telegraph and lighthouse maps of British Columbia, and a couple of maps of Nanaimo. As usual, I have surfed through the maps so you don’t have to – and some of them are remarkably fun, and informative.
Google is putting together a workshop together with the Indigenous Mapping Network:
On February 25th and 26th, 2010, Google and IMN will host a workshop on the Google campus for members and staff of indigenous groups who want to learn about Google geospatial and mobile technologies. This hands-on workshop will approach Google technologies with the special concerns of indigenous communities in mind, and will focus on the technical aspects of using Google Earth, Google Maps, Sketchup, Android mobile phones and Open Data Kit, among other technologies.
I’m pretty sure both parties are on it, but despite Google’s corporate motto of “Do No Evil” uploading sensitive, spatially-referenced cultural information to their servers seems like something that would need some thought. Nonetheless, it is interesting to see this as a pro-active direction Google is taking. Canadian First Nations are some of the most GIS-savvy anywhere in the world. One of their main networks seems to be the Aboriginal Mapping Network, who have an excellent-looking book coming out soon called Living Proof: The Essential Data-Collection Guide for Indigenous Use-and-Occupancy Map Surveys by Terry N. Tobias. Also see their handy link to data sources especially for BC.
Posted in anthropology, Cultural Resource Management, First Nations, Miscellaneous
Tagged cartography, First Nations, google, maps, Nisga'a
The Royal BC Museum was ahead of the curve in putting significant parts of its collection. One thing I like is their small but relevant collection of maps and charts. The 1849 chart inset to the left shows an “Indian Fort” in Cadboro Bay, for example. There is a good selection of Admiralty Charts from the mid 19th Century, Pemberton’s 1861 map of Victoria (the “Bay” in this section is the real “James Bay”, now landfill under the Empress Hotel , where the bridge shows is now the causeway), and a 1911 map showing the Economic geography of Haida Gwaii (which interestingly includes Sea Otter as part of the fauna “on the west coast” since that species is thought to have been extirpated much earlier). It is always surprising and sobering to see just how quickly remote areas were divided up and labelled according to their perceived economic value in a way that borders on propaganda, but there is realism too check out the instructions to family men. Now the bad news: the price of being first is often not being very good. I suspect when these went online bandwidth was a realy problem. Each chart is split up into 100kb segments and it is not possible to download the entire thing at once. The full size images must exist, so how about a quick project at the RBCM to make them downloadable in their entirety? Same goes for the picture archives.
Posted in archives, Haida Gwaii, history, Northwest Coast, Vancouver Island
Tagged archives, charts, Gulf Islands, Haida Gwaii, history, maps, Northwest Coast, RBCM, Royal BC Museum, Salish Sea, Victoria BC